Vital Signs community data, Prince Edward County

Community Well-being Dashboard

The Community Well-being Dashboard (2025) is a collaborative project bringing together local organizations to share real-time data about key measures of community health and well-being in Prince Edward County. This new resource is a central hub for tracking trends and supporting decisions that help strengthen our community’s well-being.

Well-being
Population
Economy
Education & Child Care
Environment
Food Security
Health
Housing
Safety
Transportation
Well-being

Index of Well-being - Prince Edward County

The Community Well-Being (CWB) Index measures the socio-economic well-being of communities across Canada. It combines Census data on key indicators like education, employment, income, and housing to create an overall well-being score for each community.


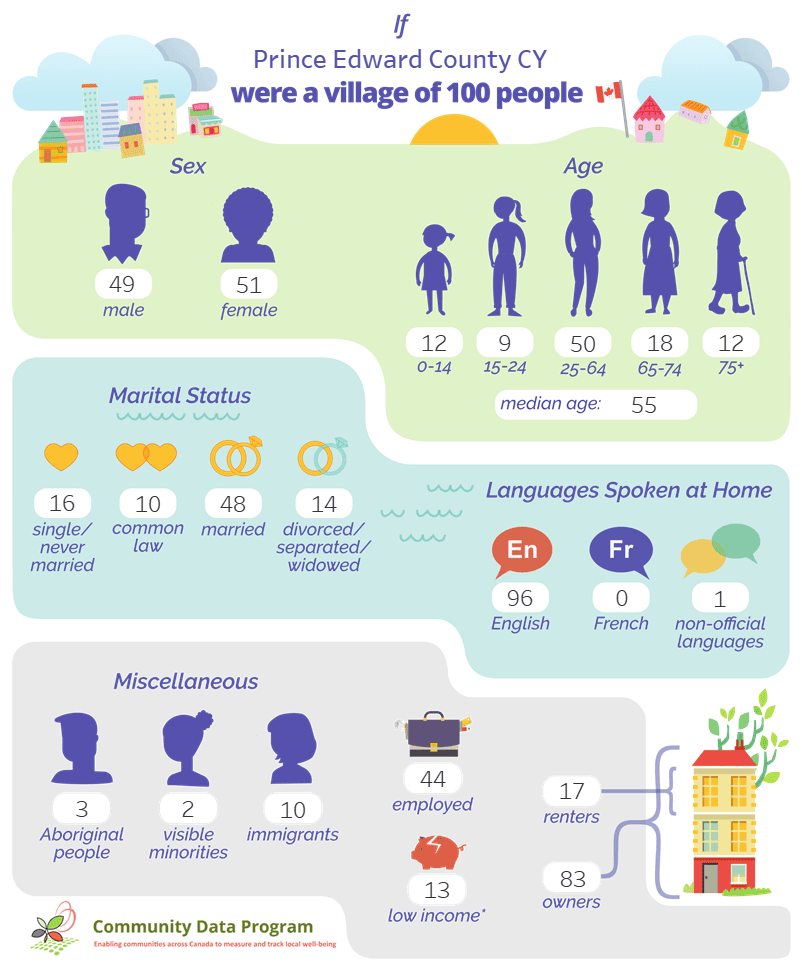
In Prince Edward County, the Index shows that quality of life has been steadily improving, especially in income levels and educational attainment. However,  these results may possibly be affected by the County’s changing demographics.

Source: Government of Canada

Population

The tables below provide data summaries. For more detailed population data, visit Vital Signs - Population.

Sources: Statistics Canada census, Environics Analytics, MPAC

Notes:  
Ontario comparison is for the most recent census year.  
*2023 and 2024 are estimates during intercensal years. Not all data is available.
Mobility status, or Residential stability rate is an an indicator of stability, investment, and connectivity to a neighbourhood. (Ontario Public Health)

Economy

The tables below provide data summaries. For more detailed economic data, visit Vital Signs - Economy.

Sources: Statistics Canada, Census, Environics Analytics, Lightcast, Community Data Program

Notes:   
Ontario comparison is for the most recent census year.   
*2023 and 2024 are estimates during intercensal years. Not all data is available.
The 2021 labour force census data was affected by pandemic restrictions. 

Sources: Statistics Canada, Census, Government of Ontario, Environics Analytics, Lightcast, University of Waterloo

Notes:  
  • Ontario comparison is for the most recent census year.                            
  • *2023 and 2024 are estimates during intercensal years. Not all data is available.
  • 2020/21 income rates were impacted by pandemic income supplements.
  • After-tax income is the total of market income and government transfers, less income tax.
  • Government income supports / transfers include government pensions, employment insurance, social assistance, the goods and services tax credit, provincial tax credits, and child benefits.
  • LIM-AT: A household is considered low income if its income is below 50% of median household incomes. It is, therefore, a relative measure of low income.
  • Gini index: Higher numbers indicate greater income inequality.
Education & Child Care

The tables below provide data summaries. For more detailed education and child care data, visit Vital Signs - Education.

Source: Statistics Canada Census of Population

Source: Ontario Data Catalogue

Source: EQAO - Education Quality and Accountability Office of Ontario.
The results show the percentage of HPEDSB students at or above the EQAO Provincial Standard.

Source: Ontario Data Catalogue

Source: HUB Child & Family Centre

Environment

The tables below provide data summaries. For more detailed environmental data, visit Vital Signs - Environment and Protection of Farmland.

Definitions

Biocapacity: Biocapacity refers to the capacity of a given biologically productive area to generate an on-going supply of renewable resources and to absorb its spillover wastes. Unsustainability occurs if the area's ecological footprint exceeds its biocapacity.
Household consumption includes personal transport, services, food, housing, goods.

Ecological Footprint: The amount of land needed to support consumption of ecosystem goods and services, shown as global hectares per capita. Components of ecological footprint include wetlands, built up land, grazing land, fishing grounds, cropland and forests.

Biocapacity balance: The difference between biocapacity (ecosystem supply) and Ecological Footprint (ecosystem demand), shown as global hectares per capita.

Gha: Global hectares. This is a spatial unit that enables comparisons at different scales, locations.

Protected Area: The proportion of area that is under federal, provincial, greenbelt or municipal protection, along with areas protected by non-profit organizations, land trusts and agencies. 

Total Farm Area is considered the total land owned, used and/or controlled by active farmers. For more details on farmland protection, see https://vitalsigns.thecountyfoundation.ca/data/post/protection-of-farm-land

Food Security

The tables below provide data summaries. For more detailed food security data, visit Vital Signs - Food Security.

Sources: HPE Public Health, Statistics Canada, local food banks, Food to Share, Food for Learning

Notes:
*Use rates of food insecurity with caution as they are estimated. There are varying levels of food insecurity and methods of data collection, making comparisons difficult.
Food insecurity in this report refers to people living in households that experienced marginal, moderate or severe food insecurity.
The capacity of Food to Share depends on the availability of both kitchen space and food supplies.  

Health

The tables below provide data summaries. For more detailed health data, visit Vital Signs - Health.

Source: Statistics Canada. Table 13-10-0113-01  Health characteristics, two-year period estimates 
Note: Hastings Prince Edward (HPE) is the health region.
* use this statistic with caution.

Sources: Statistics Canada, Public Health Ontario

Housing

The tables below provide data summaries. For more detailed housing data, visit Vital Signs - Housing.

Safety

The tables below provide data summaries. For more detailed community safety data, visit Vital Signs - Safety.

Transportation

The tables below provide data summaries. For more detailed transportation data, visit Vital Signs - Transportation.

Note that the dashboard is optimized for viewing on a desktop screen. Some elements may look and function differently on a mobile device or tablet. 
Terms of Use: While we strive for accuracy, The County Foundation is not responsible for any errors or omissions, or for decisions made based on this information. Sources are posted for you to verify. If you spot an update or correction, please let us know at vitalsigns@thecountyfoundation.ca.