
Vital Signs Data
Prince Edward County, Ontario, Canada.
Updated: July 11, 2025
Sustainable Development Goal (SDG)
SDG 11: Make communities inclusive, safe, resilient and sustainable.


Population Overview
The growth rate of 3.9% from 2016 to 2021 compares to Ontario’s population increase of 5.8% and the national average of 5.2% during this timeframe. Within PEC, the Village of Wellington experienced a 12.8% growth rate, while the Town of Picton’s population grew by 2.6%.
Sources: Statistics Canada census, Environics Analytics, MPAC
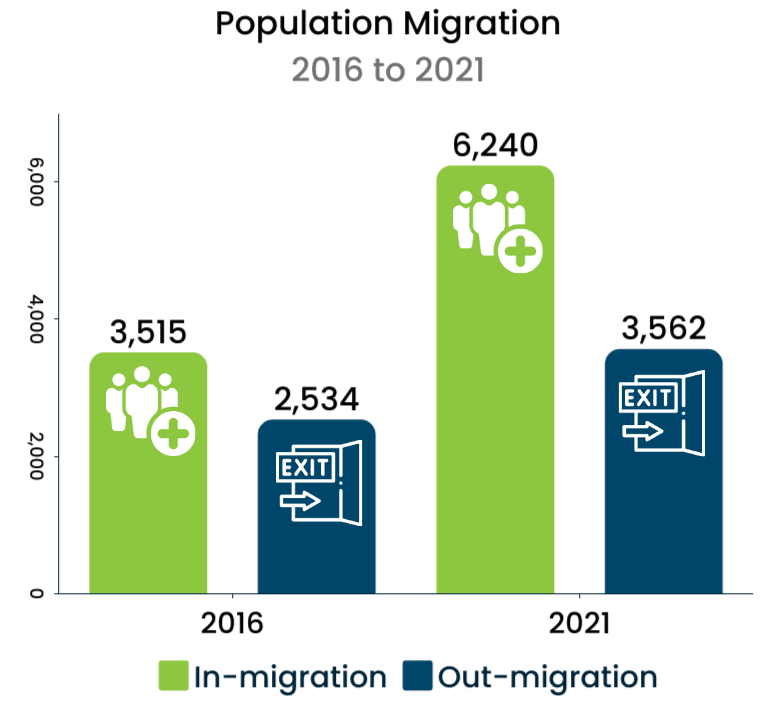
Migration
- An in-migration of 6,240 people to PEC from 2016 to 2021, attributed partly to the pandemic and remote work, impacted housing supply and prices. This is compared to 3,515 in the previous census period.
- In the same timeframe, 3,562 residents left compared to 2,534 in the previous census period. Reasons for relocation vary, with factors such as housing affordability, gentrification, and real estate trends playing roles.
Population Diversity
Visible Minorities
In 2021 in Prince Edward, 3.1 percent of the population was classified as a visible minority, an increase of 0.9 percent since 2016. However, this is still far below the provincial rate of 34.3%. As more people choose to call PEC home, our BIPOC (Black, Indigenous, People of Colour) community is also growing. As the BIPOC community grows, so do reports of racist incidents happening across PEC. See the 2022 survey results.
All Welcome Here Rural BIPOC Association is focused on connecting residents to each other, to anti-racist education, and to pathways to local action. See details at allwelcomehere.ca
Identifying as Indigenous
In 2021, 3.2 percent of Prince Edward residents identified as Indigenous, compared to the province at 2.9 percent. That’s up 6.7 percent since 2016. Of those, 2.1 percent reported a First Nations identity and 0.8 percent reported a Métis identity. An additional 0.2 percent reported other Indigenous identities.
Tyendinaga Mohawk Territory is our neighbouring community.
Immigrants
In 2021, 10 percent of the population was foreign-born, 20 percentage points lower than the provincial average (30%). The percent of the population that is foreign-born is down 0.9 percentage points from 2016 (10.9%).
New to the community?
The Newcomers Group provides an opportunity to meet other people who are new to the area as well as share all the great restaurants, shops and groups you’ve learned about. You can also bring any questions you might have. Guest speakers will be invited to share information about their organizations. Reserve your space at peclibrary.org.
Gender Diverse

The 2021 Statistics Canada Census of Population included for the first time a question on gender and the precision of “at birth” on the sex question, allowing all cisgender, transgender and non-binary individuals to report their gender. Canada is the first country to collect and publish data on gender diversity from a national census.
About 4% of Canadians aged 15 years and older identify as lesbian, gay, bisexual, or with a different sexual orientation than heterosexual. In PEC, that would be over 1,000 individuals.
Over time, the acceptance and understanding of gender and sexual diversity has evolved. Further, there has been social and legislative recognition of transgender, non-binary and LGBTQ2+ people in general. Younger generations may be more comfortable reporting their gender identity than older generations. (The Daily, Statistics Canada 2022-04-27)
Locally, support and allyship locally is shown through:
- County Pride events and Rainbow registered businesses
- GSA gender & sexuality alliance at Prince Edward Collegiate.
- Discover YOUth! is an all-inclusive weekly drop-in for 2SLGBTQ+ youth and allies. The program features guest speakers, field trips, art projects and of course – snacks! For youth ages 12+. Have Questions? Visit www.peclibrary.org/lgbtq. Transportation can be arranged for youth in need.
- More can be done, for example youth have asked for consistent access to sexual health education that is inclusive and relevant, and for mental health support from qualified professionals with lived experience.
Population by age
Prince Edward County is experiencing an aging population and a declining workforce-aged demographic.
With a *median age of 56.5 (2023) - 16.5 years above the Ontario average - the County ranks among the oldest communities in the province. Notably, this is also the fastest-growing age group.
Youth Population (0 to 14 years): In 2024, youth make up 11.25 percent of the local population, below the provincial average of 14.7 percent. Post-pandemic, the youth population rose slightly despite a stable local birth rate (see below). This growth was primarily due to new families relocating to the area during the pandemic, putting pressure on the capacity of childcare services and primary school classrooms.
Ages 15 to 64: In 2024, PEC's working age population ages 15 to 64 comprise 53.5 percent of the population, compared to the provincial average of 67 percent. This age range continues to decline. PEC is projected to have less than 50 per cent of its population aged 15–64 by 2046.
Younger generations, such as millennials and Generation Z, are more educated and diverse than previous generations. These generations, who are still young, are more exposed to ethnocultural, religious and gender diversity and have grown up in an interconnected technological world that has a significant impact on their values and lifestyles. These generations now make up a considerable share of the working-age population, leading to changes in the labour market. (A generational portrait of Canada’s aging population from the 2021 Census, Statistics Canada)
In PEC, the inflow of highly experienced and skilled early retirees contributes to the large active volunteer base.
The fact that baby boomers are reaching more advanced ages is gradually putting more pressure on the health and home care system, as well as on pension plans, although many people in this generation are currently choosing to stay in the workforce longer. As well, in the midst of high job vacancies and historically low unemployment, Canada faces record retirements from an aging labour force. (A generational portrait of Canada’s aging population from the 2021 Census, Statistics Canada)
Further considerations for senior support include vulnerability stemming from the increased likelihood of ill health, low income, impaired mobility, social supports, more susceptibility to victimization and financial fraud, and social and geographical isolation in rural areas. (Rural Ontario Institute), (Prince Edward County Police Services Board. Community Safety and Well-being Plan)
*Median age is the age that divides a population into two numerically equally sized groups; that is, half the people are younger than this age and half are older.
PEC’s population drastically increases in the summer due to tourism. Prince Edward County was identified in Travel & Leisure Magazine’s list of top 50 places to visit in the world.
Planning services for fluctuating populations is challenging. Seasonal populations vary by time of year, average age, activities, participation in the local community, and healthcare needs. One of the greatest impacts of seasonal populations is on emergency services and related infrastructure.
The population of seasonal residents (those who own seasonal properties) has been increasing faster than the permanent population. In 2022, the estimated number of seasonal residents (ages 18+) is 8,644.
That’s 25% of the total permanent and seasonal adult population (ages 18+). (MPAC)
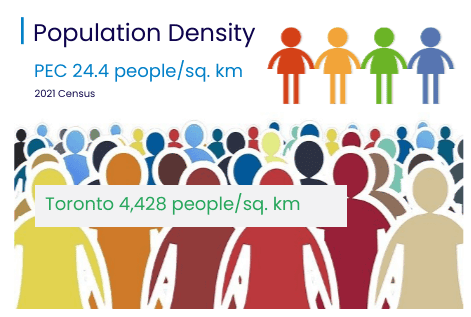
Population density
Population density
Prince Edward County is larger in km² than the city of Toronto, with a small population spread over 1050 km². PEC’s population density is low at 24.4 people per sq/km compared to Toronto at 4,428 people per sq/km.
At least 77 percent of the population lives rurally. Amenities and services are concentrated in two main towns. Picton (population 4,508) and Wellington (population 1,526) are the County’s largest centres. (Statistics Canada: Population and Dwelling Counts 2021)
Sources
Seasonal residents: MPAC (custom request)
Population projections: Ontario Ministry of Finance Annual population projections from 2023 to 2051, Ontario Population Projections, 2023-2051
Statistics Canada:
- Birth and Death rates 2006 to 2021 - Components of population change by census division
- Population estimates in 2023 & 2024 - Statistics Canada Annual Demographic Estimates: Subprovincial Areas, July 1, 2023
- Prince Edward County 2021 Census Profile
- Prince Edward County 2016 Census Profile
- Statistics Canada. Focus on Geography Series, 2011 Census
- National Household Survey (NHS) Profile 2011
- Prince Edward County 2006 Census Profile
