Prince Edward County, Ontario, Canada.
Updated December 29, 2023
Household Characteristics | 2006 PEC | 2011 PEC | 2016 PEC | 2021 PEC | 2021 Ontario |
---|---|---|---|---|---|
Private dwellings occupied by usual residents | 10,319 | 10,550 | 10,728 | 11,332 | -- |
Median value of dwellings (single residential) | $205,000 (2008) | $225,000 | $299,800 | $600,000 | $700,000 |
Tenure: Owning (%) | 81.0% | 81% | 83.1% | 81.6% | 68.4% |
Tenure: Renting (%) | 18.8% | 19% | 16.9% | 18.4% | 31.4% |
Residential stability (5+ years at the same address) | 66.2% | -- | 72.0% | 63.0% | 62.6% |
Average household size (persons) | 2.4 | 2.6 | 2.2 | 2.2 | 2.6 |
One person households | 22.2% | 23.7% | 25.4% | 27% | 26.5% |
Single-parent households (%) | 9.9% | 10.5% | 10.5% | 10.6% | 17.1% |
Major Repairs Needed (%) | 6.4% | 9.5% | 8.3% | 7.3% | 5.7% |
Shelter costs: Spending 30% or more of income | -- | 25.7% | 22.8% | 16.7% | 24.2% |
Owner shelter costs > 30% of income | -- | 22.2% | 17.3% | 11.9% | 17.7% |
Tenant shelter costs > 30% of income | -- | 41.4% | 48.9% | 37.8% | 38.4% |
Private dwellings NOT occupied by permanent residents | 1,736 (14.4%) | -- | 2,171 (16.8%) | 2,225 (16.4%) | 7.4% |
Median value of dwellings
The median value of houses doubled between 2016 and 2021. See more info at Housing-Owning.
Single parent families
At 10.6%, the percent of single parent families is 38% lower than Ontario. Single mothers are particularly susceptible to poverty.
Tenure: Owning/Renting
The percentage of home ownership is higher than Ontario. This is typical of rural areas compared to urban.
Housing suitability
Housing suitability refers to whether a private household is living in suitable accommodations according to the National Occupancy Standard (NOS); that is, whether the dwelling has enough bedrooms for the size and composition of the household. PEC fares slightly better than Ontario.
Shelter costs
Shelter-cost-to-income ratio refers to the proportion of average total income of household which is spent on shelter costs. Shelter consumption costs include: rent, maintenance/repair, insurance, utilities, and transportation. A higher ratio indicates lower levels of affordability.
Spending more than 30% of household income on housing exceeds Canada Mortgage and Housing Corporation’s affordability threshold.
Rented households in PEC are most affected by lack of affordability.
The reference period for shelter cost data is 2021, while household total income is reported for the year 2020. Some household incomes were temparily boosted in 2020 with Covid-19 government relief payments.
Private dwellings NOT occupied by permanent residents
16.4% of the housing inventory (2,225 of 13,557 dwellings) may be in use as second homes or vacation rentals. This is high compared to Toronto and Ontario both at 7.4%.
Average household size
The average household size in PEC at 2.2 percent is lower than Ontario at 2.6.
PEC has 2.3 percent of multi-generational households compared to Ontario at 4 percent.
Occupied by one person
3,005 (27%) of households are occupied by only one person, of whom 1,750 are widowed. Single adults are particularly susceptible to poverty.
» Also see Alternative Housing Models that can more effectively respond to local housing needs and changes in demand.
Also see …
Private dwellings with single occupancy, single parent families;…
Impact; Affordable housing developments; What is being done
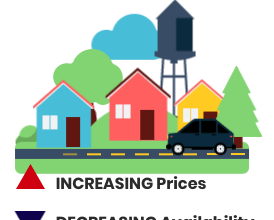
The housing shortage and high prices, coupled with…
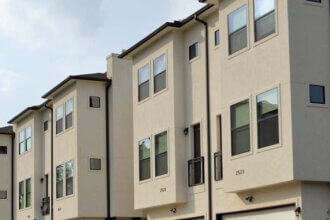
Similar to the purchasing market, overbidding in the…
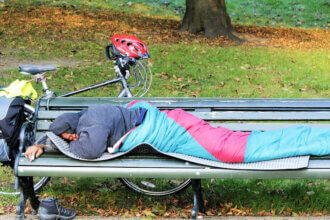
Homeless count, threats to housing stability, homelessness facts,…
Housing: Advancing well-being together: County Housing Plan, Exploring…
Sign in to your account