


 Between 2016-17, up to half of the home sales in the County were attributed to new short-term accommodations (STAs). The relative importance of STAs in deteriorating housing affordability has declined significantly since 2019, as reported by Prof. David Wachsmuth, a Canada Research Chair in Urban Governance Associate at the School of Urban Planning at McGill University.

Household Characteristics
Private dwellings with single occupancy, single parent families;…

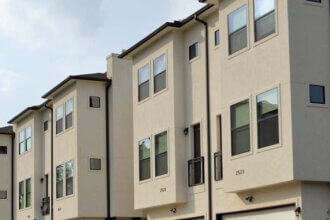
Affordable Housing
Impact; Affordable housing developments; What is being done
Owning
The housing shortage and high prices, coupled with…
Renting
Similar to the purchasing market, overbidding in the…
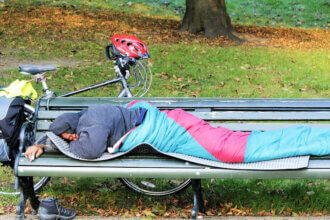
Homelessness
Homeless count, threats to housing stability, homelessness facts,…

Housing – Actions
Housing: Advancing well-being together: County Housing Plan, Exploring…