Vital Signs Data
Sustainable Development Goals (SDGs)
SDG 4: Ensure inclusive and equitable quality education and promote lifelong learning opportunities for all.
SDG 4.2: Ensure that all girls and boys have access to quality early childhood development, care and preprimary education so that they are ready for primary education.

Adult educational attainment
Adult educational attainment
Education begins before school, through child care and early learning, and continues beyond high school into college, university, apprenticeships, and lifelong learning. It helps people adapt to a changing world.
Educational attainment measures the highest level of formal schooling community members have completed. As of 2021, 90.8% of PEC adults aged 25 to 64 have earned a certificate, diploma, or degree, up from 85.7% in 2006.
Although adult educational attainment has been rising, the changing demographics of new residents may be a contributing factor.
- More PEC students pursue college or non-university diplomas than the provincial average (31.2% vs. 23.6%), while fewer pursue university degrees (24% vs. 36.8%).
- Among youth aged 18 to 24 from Prince Edward County, 34.2% were attending postsecondary school, compared to 51.5% in Ontario and 50.2% in Canada overall.
- In PEC, 820 people (6.7%) hold an apprenticeship or trades certificate or diploma, down from 2,315 (12.2%) in 2011. This decline mirrors a broader provincial trend, with Ontario's rate at 5.1%.
Every gain in community educational levels makes a positive difference. A one percent increase in adult literacy would create an economic benefit of $67 billion in the gross domestic product for Canada (2018 prices).
Grade 12 graduation rates
Challenges to success include:
- increased absenteeism, in particular the Gr 12 and Gr 8 students. Gr 8 is most concerning.
- high staffing needs across all positions – recruitment and onboarding within the school system due to large retirement numbers.
Hastings Prince Edward District School Board continues to work toward increasing graduation rates by implementing several strategies including Grade 9 de-streaming in core subjects, increased opportunities for alternative learning and secondary pathways and continued collaboration with Student Service Departments to ensure students with special education needs receive optimal supports.
The four-year and five-year graduation rate is calculated as the percentage of students who receive an OSSD within four or five years of starting Grade 9. High school graduation measures the percent of students who earn 18 compulsory credits and 12 optional credits; pass the *OSSTL literacy requirement; and complete a minimum of 40 hours of community involvement activities.
Students are now required to earn two e-Learning credits to graduate from secondary school, beginning with every student who entered Grade 9 in the 2020-2021 school year.
*The literacy graduation requirement was waived for students graduating in the 2020-21 and the 2021-22 school years. This requirement was restored for students graduating in the 2022-23 school year. (Ontario High school graduation requirements)
Standardized test results
The provincial Education Quality and Accountability Office (EQAO) tests offer insights into whether students are meeting curriculum expectations in reading, writing and math at key stages of their education, as well as students’ attitudes and habits towards learning. (EQAO assessment results)
Reading, writing, and math scores for students in grades 3 to 10 have historically fallen below the provincial standard in the HPE Board of Education, with math scores being particularly concerning—a trend reflected across Ontario. However, progress is being made in the post-COVID period.
Early years development
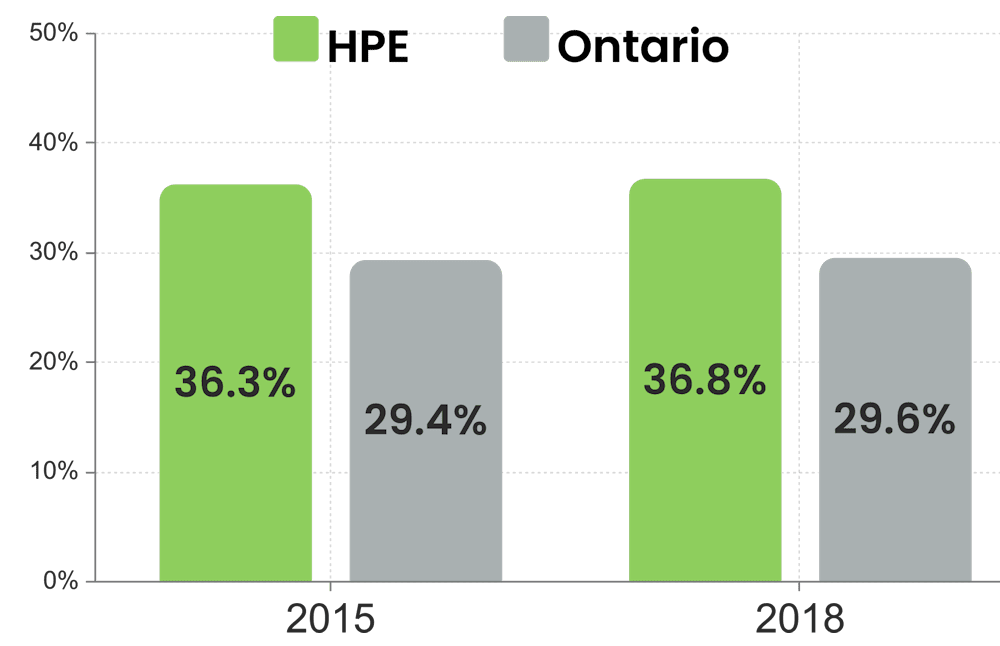
Almost 4 out of 10 Hastings Prince Edward (HPE) preschoolers are vulnerable in one or more domains of early development, compared to their Ontario peers at about 3 out of 10 (as of 2018).
Little progress was made since Cycle 1 of EDI testing in 2003, with the exception of improvements in the domain of Communication Skills and General Knowledge. Physical health and well-being is the domain with the largest gap compared to Ontario peers. (Government of Ontario Data Catalogue. Early Development Instrument (EDI) Cycles 1-3 and Cycle 4 (2004 to 2015)

Early Development testing measures:
- Physical Health and Well-Being: Children are happy, healthy, rested each day.
- Social competence: Children play and get along with others, share, show confidence.
- Emotional maturity: Children are able to concentrate on tasks, help others, show patience, are not often aggressive or angry.
- Language and thinking skills: Children are interested in reading and writing, can count and recognize numbers, shapes.
- Communication skills and general knowledge: Children can tell a story, communicate with adults and other children.
Childcare
The Hub Child & Family Centre offers 176 full-time spaces across its two sites in Picton and Massassauga-Rednersville, and through home childcare. The waiting list has increased significantly since 2014, driven by an increase in the population ages 0-9. Capacity for registered full-time child care is constrained by both staffing and space limitations. After-school childcare is also available at public schools: Kente, St. Gregory’s, CML Snider, Sophiasburgh and PECI.
"Difficulty accessing child care has caused about one-third of respondents to adjust work or study schedules, reduce hours, or delay returning to work." (Statistics Canada 2023)
Canada ranks 33rd out of 35 OECD countries for early childhood education enrollment. (Early Years Study 4: Thriving Kids, Thriving Society)

