
Vital Signs Data
Sustainable Development Goal (SDG)
SDG 3: Ensure healthy lives and promote well-being for all at all ages.
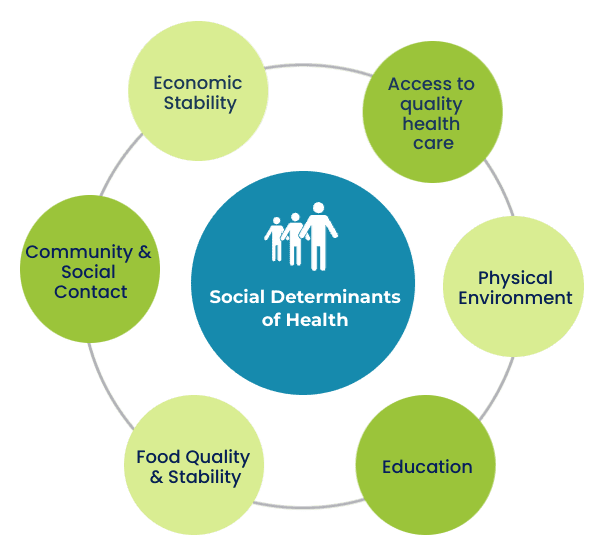
Social Determinants of Health
Hastings Prince Edward Health Characteristics
Hastings Prince Edward Health Characteristics
Note: * use with caution
Beginning in 2023, the coverage of the Canadian Community Health Survey (CCHS) was changed to include adults aged 18 and older.
Source: Statistics Canada, Canadian Community Health Survey (CCHS). Table 13-10-0113-01 Health characteristics, two-year period estimates
Perceived good health is considerably lower than the province. The older population could be a factor. The status was rising in 2017/18 but fell starting in 2019/20, possibly influenced by the pandemic.
Perceived good mental health status across all age groups declined starting in 2019/20.
Perceived poor mental health is statistically higher than the provincial average.
Obesity: In adults in HPE and Ontario, rates of obesity have been increasing over time. HPE is 9.4 percentage points higher than the provincial average. There are higher rates of overweight and obesity in adults in rural areas.
Rates of chronic disease
HPE residents fall within several high-risk health categories. When compared with the province, the median age of citizens is higher, as is the prevalence of chronic disease. HPE has a high level of potentially avoidable mortality, which is the combination of both treatable and preventable causes of death when compared to Ontario.
Access to a regular healthcare provider decreased from 92.8% to 80.8% (2016 to 2023), 6.8% less than average for Ontario. Research shows that people who do not have a primary care provider have worse health and higher rates of preventable diseases. (Canadian Institute for Health Information. Better access to primary care key to improving health of Canadians.)
Also see PEC Health Care Services – doctor access.
See Prince Edward Family Health Team Living Well with Chronic Conditions (COPD, CHF, diabetes, asthma, depression (mild-moderate), or attending Cardiac Rehab)
Mental Health
SDG 3.4: Promote mental health and well-being.
SDG 3.5: Strengthen the prevention and treatment of substance abuse, including narcotic drug abuse and harmful use of alcohol.
In 2022, 10.4% of Canadians aged 15 and older had a mental health disability. (Stats Can Survey on Disability 2022) In any given year, 1 in 5 Canadians experiences a mental illness. Canadians in the lowest income group are 3 to 4 times more likely than those in the highest income group to report poor to fair mental health. (Centre for Addiction and Mental Health)
In Prince Edward County, alcohol use, anxiety, depression and stimulant use are among the top reasons for mental health service calls. (ConnexOntario)
Self-reported poor or fair mental health started to spike in 2020. Pandemic-related lockdowns intensified a sense of isolation and disconnection, and people lost their sense of safety as well as certainty about the future, jobs and lives (Centre for Addiction and Mental Health). (Canadian Mental Health Association, “COVID-19 Effects the Mental Health of Vulnerable Populations”) The COVID-19 pandemic had a negative effect on all ages, especially impacting youth mental health.
Mental Health among adolescents
The Centre for Addiction and Mental Health (CAMH) 2021 survey found that 59% of students surveyed said the pandemic has made them feel depressed about the future, and 18% had seriously contemplated suicide in the past year.

The increased need for mental health services is further straining a system that was already overwhelmed. Local mental health support for both children and adults is scarce, with long waitlists and limited services. Addiction treatment requires travel to Kingston for the nearest detox program. PEC OPP have seen a 25% Increase in mental health act incidents in 2023 (over the 9 year average 2014 to 2023). (Police Services Board 2024 Report)
Mental Health of PEC Youth
The Greater Than County Youth Collective PEC youth surveys in 2021 captured the experiences of County youth between the ages of 12-29. Overall, 72 youth participated in the surveys and 19 took part in focus groups. The report compared results from youth surveys in 2017, 2018, and 2021. See the full report.
The most vulnerable subgroups include those who are racialized, low-income, are living with disabilities, and LGBTQSIA+ youth. Barriers to mental health support expressed by PEC youth are:
- long wait times for mental health support
- the desire for counsellors with lived experience, esp. to support LGBTQ2S+ and BIPOC youth
- transportation, especially for those in rural areas and youth with physical disabilities.
Mental Health of Farmers
Farmers in Canada experience higher levels of anxiety, depression, stress, emotional exhaustion, cynicism, and alcohol use compared to the general population. In the 2021 National Survey of Farmer Mental Health, 76% reported moderate to high stress levels. This is largely due to factors beyond their control, such as weather, market prices, trade policies, and crop or animal disease outbreaks. The Farmer Wellness Initiative supports Ontario farmers, farm workers, and their families with free and unlimited mental health counselling.
Problematic Substance Use
Substance use disorder (sometimes called problematic substance use or substance abuse),
Substance use can lead to a brain injury, particularly in the case of opioids or impairment from alcohol and other drugs. (Brain Injury Canada)
Substance use was on the rise in Canada during COVID-19. Canadians who described their mental health as ‘fair’ or ‘poor’ were more likely to have increased their use of alcohol, cannabis and tobacco during the early stages of the pandemic. Their increased substance use is attributed to feelings of stress and anxiety, loss of routine and social isolation. (Canadian Mental Health Association, “COVID-19 Effects the Mental Health of Vulnerable Populations”)
Problematic substance use in Hastings Prince Edward (HPE)
Problematic substance use in Hastings Prince Edward (HPE)
Problematic substance use in the Hastings Prince Edward Health Region (HPEC) is higher than the Ontario average.
Note: Heavy drinking refers to males who reported having 5 or more drinks, or women who reported having 4 or more drinks, on one occasion, at least once a month in the past year.
Sources:
- HPE Public Health Opioid Monitoring
- Public Health Ontario Cannabis Harms
- Public Health Ontario Alcohol Harms
- Public Health Ontario Smoking Status
- Statistics Canada. Table 13-10-0113-01 Health characteristics, two-year period estimates
Increased Health Risks for Seniors

Hastings Prince Edward residents face increased health risks, with a higher median age and greater prevalence of chronic diseases (Ontario Public Health)and amputations (Ontario Health) compared to the provincial average.
Support is essential for:
- Preventive healthcare
- Helping seniors live independently at home longer
Birth & Death Rates
Sources:
Statistics Canada. Statistics Canada. Table 13-10-0389-01 Life expectancy
Statistics Canada. Table 17-10-0140-01 Components of population change by census division
Public Health Ontario. Mortality from Avoidable Causes.
Mortality from Avoidable Causes
Prince Edward County Birth Rates by Age of Mother
The trend shows more births among mothers aged 35 and older, and fewer births among younger mothers. Births to teenage mothers are declining. However, families with young mothers remain at increased risk for negative health and social outcomes. (Public Health Agency of Canada)
