
Vital Signs Data
Updated March 25, 2025
Median value of dwellings
The median value of houses doubled between 2016 and 2021. See more info at Housing-Owning.
Tenure: Owning/Renting
The home ownership rate in PEC is higher than the provincial average, a trend commonly seen in rural areas compared to urban settings.
Residential stability
The percentage of the population that has remained at the same address for five or more years. Residential stability is an indicator of stability, investment, and connectivity to a neighbourhood. (Urban Institute. Family Residential Instability)
Housing suitability
Housing suitability refers to whether a private household is living in suitable accommodations according to the National Occupancy Standard (NOS); that is, whether the dwelling has enough bedrooms for the size and composition of the household. PEC fares slightly better than Ontario.
Major repairs needed
The "major repairs needed" category includes homes requiring significant repairs, such as fixing defective plumbing or electrical systems, as well as structural repairs to walls, floors, or ceilings. In PEC, 7.3% of households fall into this category, exceeding the provincial average. This figure may be influenced by the high rate of home ownership in the area.
Shelter costs
⚠ * The reference period for shelter cost data is 2021, while household total income is reported for the year 2020. Some household incomes were temporarily boosted in 2020 with Covid-19 government relief payments.
Shelter-cost-to-income ratio refers to the proportion of average total income of household which is spent on shelter costs. Shelter consumption costs include: rent, maintenance/repair, insurance, utilities, and transportation. A higher ratio indicates lower levels of affordability.
Spending more than 30% of household income on housing exceeds Canada Mortgage and
Housing Corporation’s affordability threshold. Rented households in PEC are most affected
by lack of affordability.
Average household size
The average household size in PEC at 2.2 percent is lower than Ontario at 2.6.
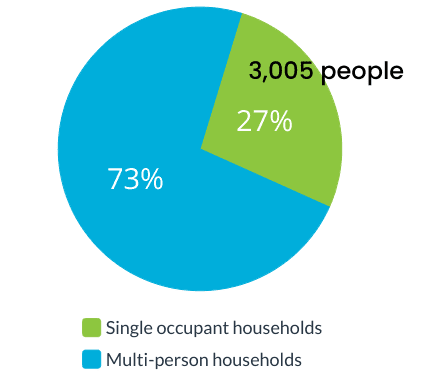
Occupied by one person
3,005 (27%) of households are occupied by only one person, of whom 1,750 are widowed. Single adults are particularly susceptible to poverty.
Single parent families
At 10.6%, the percent of single parent families is 38% lower than Ontario. Single mothers are vulnerable to poverty.
Multigenerational households
Rising housing costs and limited housing options are driving an increase in multigenerational households. PEC has 2.3 percent of multi-generational households compared to Ontario at 4 percent.
Private dwellings NOT occupied by permanent residents
These dwellings may be used as second homes or vacation rentals, making up 16.4% of all private homes in PEC—more than double the provincial average of 7.4%. 850 short-term accommodation (STA) businesses are registered in PEC as of November 11/24.
