
Vital Signs Data
Sustainable Development Goal (SDG)
SDG 8: Ensure sustained and inclusive economic growth to drive progress, create decent jobs for all and improve living standards.
Income Indicators
Income Indicators
- PEC's household income historically lags behind the province.
- Low income (LIM-AT) is defined as less than 50% median after-tax household income.
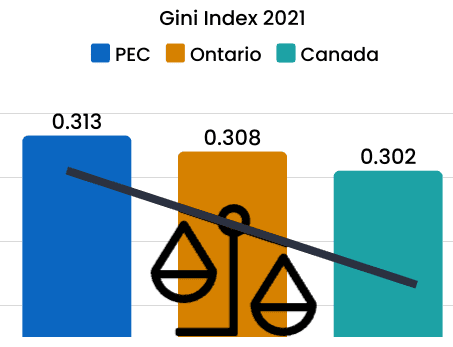
- Income inequality (Gini index) measures how evenly income is shared in a region. The higher the Gini index, the more unequal the income distribution is. PEC's inequality score is higher than Ontario.
Income Disparities
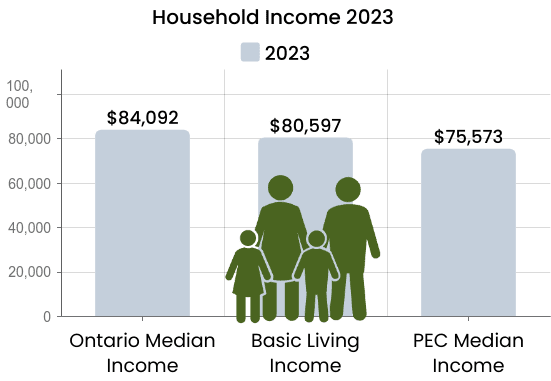
The median after-tax household income in Ontario is $84,092, compared to $75,573 in PEC. (Environics Analytics)
18.5% of PEC workers are employed in food services, accommodation and retail sales – sectors with the lowest average weekly earnings. See industry composition.
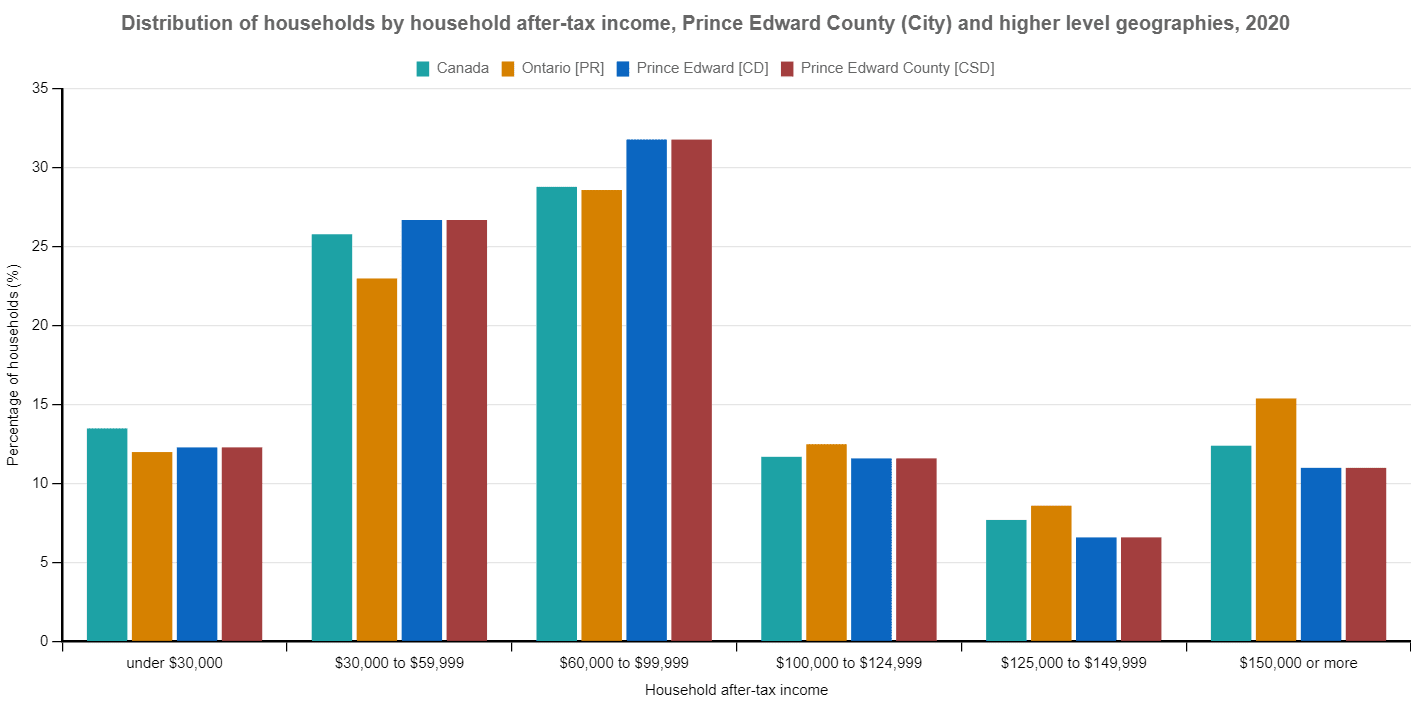
Household after-tax income in 2023
Inequalities
The pandemic deepened societal inequalities, widening the gap between those who are doing well and those who are not. Low-income workers are being driven further into poverty and insecurity. Many low-wage jobs were lost while high-wage jobs surged.
“Inequality makes for unhealthier societies. Life expectancy, literacy, infant mortality, imprisonment, murder rates, obesity, teen birthrates, mental illness (including addiction), social mobility, trust — all get worse across the entire income spectrum when the gap between rich and poor widens.”
Richard Wilkinson, Public Health Researcher
Wage Inequities
- Women are more likely than men to be working for minimum wage. A gender pay gap persists across all jobs in the country, with women earning 29 per cent less than men annually. (Canadian Women The Gender Pay Gap )
- The proportion of immigrant employees who earn minimum wage is greater than Canadian-born employees. (Canada, Towards a Poverty Reduction Strategy – Discussion Paper)
Growing Gap Between High and Low Incomes
The Gini index (at right) measures income inequality, showing how evenly income is distributed in a population. Higher numbers indicate higher inequality, a greater gap between the incomes of the richest and poorest people.
High income inequality can lead to problems like slower economic growth, less income mobility, more household debt, political divisions, and higher poverty rates.
Statistics Canada. 2021 Census of Population, Focus on Geography
Declining Affordability in 2025
- 50% of Ontario residents surveyed report that they are $200 away or less from not being able to meet all their monthly financial obligations. This is an increase of 7 points (YoY) since 2024. The average amount left after monthly expenses fell to from $884 to $725.
- 44% report having six months of emergency savings, leaving many households highly exposed to disruption.
- Ontarians are also the most likely of the provinces (23%) to say they are delaying or skipping medical, dental, or prescription care, highlighting how financial strain is affecting households’ well-being.
- Three in 10 (31%, +7 pts YoY) Ontarians say they have reduced their utility consumption, while a quarter (26%, -2 pts YoY) report eating less to save money.
- More than two in five Ontarians worry that AI could negatively affect their job or income (45%).(MNP Consumer Debt Index)
Dependence on Income Supports
In 2020, Prince Edward County’s reliance on government income supports rose from 16.7% to 19.9%, with 3.9% coming from COVID-19 relief benefits. In Ontario, reliance increased from 11.1% to 17.1%, including 5.5% from COVID-19 supports.
Additionally, over one-third of PEC’s population is aged 65 and older, making them eligible for Old Age Security (OAS) benefits.
As of March 31, 2023, 1200 PEC households rely on income from the ODSP Ontario Disability Support Program (Ministry of Children, Community and Social Services) and 234 households rely on Ontario Works (PELA Social Services). Income from these programs is well below the poverty line.
Dependency on Social Assistance income as of March 31, 2023:
| Adults | Children | Total | |
|---|---|---|---|
| Ontario Works | 253 | 160 | 413 people |
| 234 households | |||
| ODSP | 1200 households | ||
| 1434 people |
